Feature area 06 / 06
Flow analysis, network map, SRT and RIST
Know what is on the network before you judge it. The probe lists every flow, endpoint and device it sees, draws the network, measures the packet timing of each flow and monitors SRT and RIST passively.
- UDP / RTP
- IPv4 / IPv6
- VLAN
- IGMP multicast
- SRT
- RIST
- MDI
- IEEE OUI
FLOWS / ENDPOINTS / DEVICES
An inventory that keeps itself
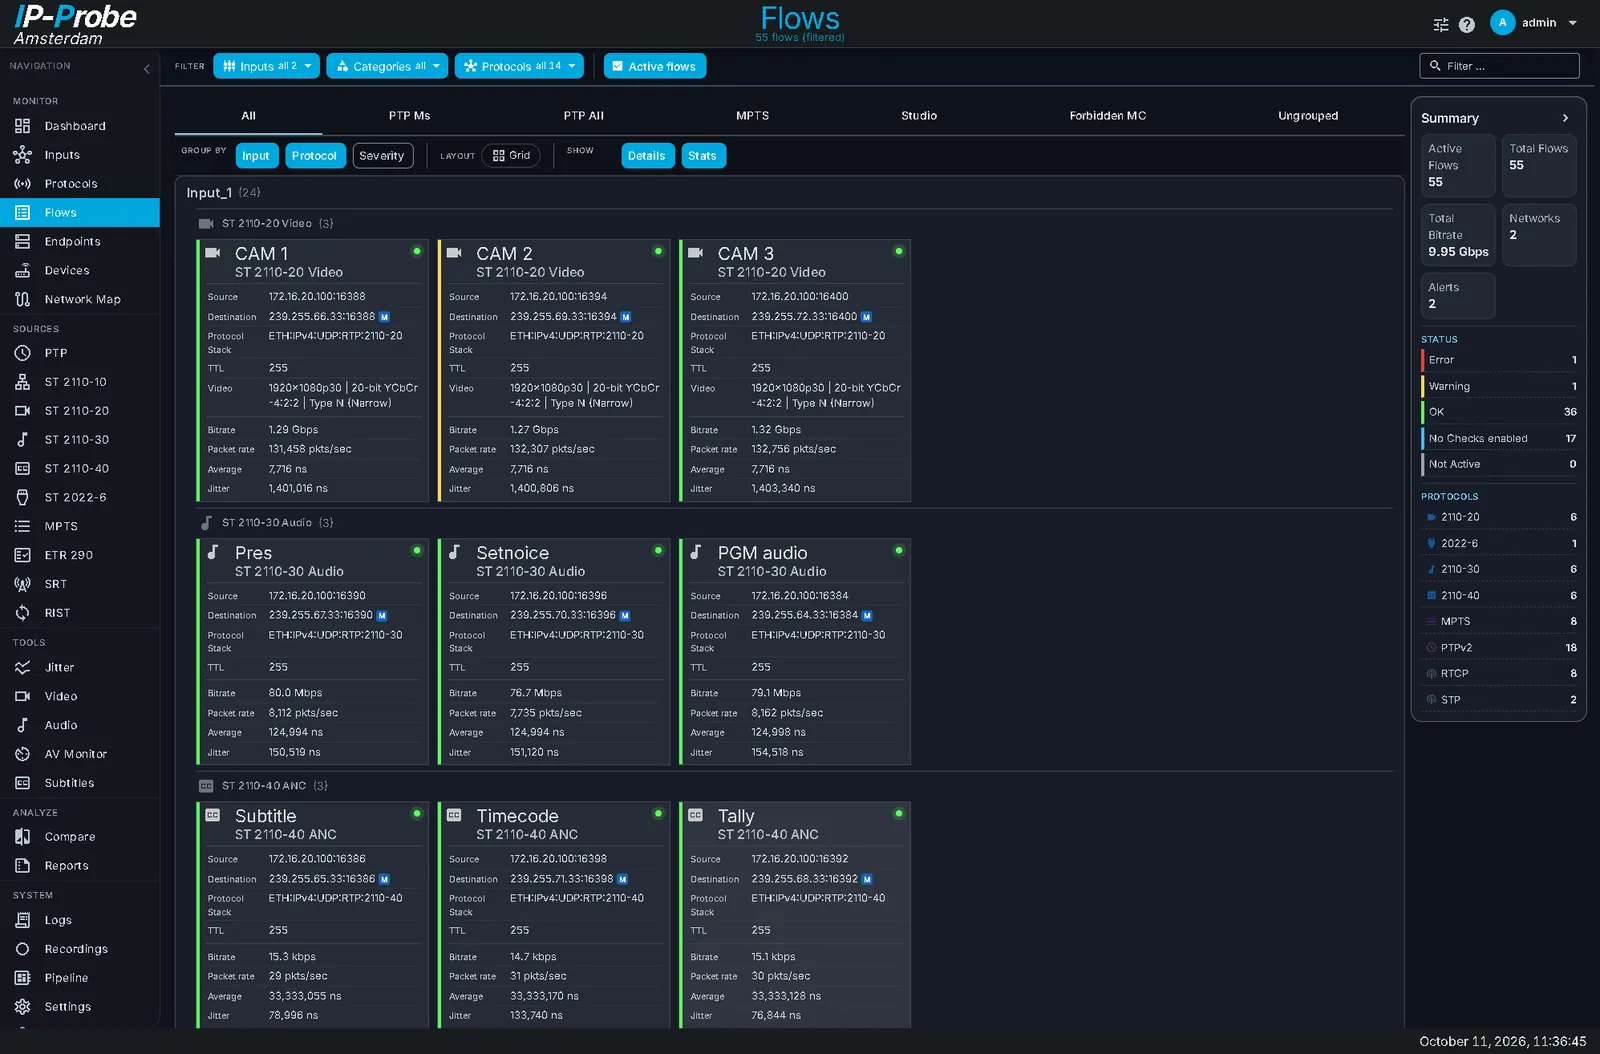
- Flows grouped by input, protocol, severity or your groups, as cards or a list
- Flow detail: summary, network headers (Ethernet, IP, UDP, RTP) and payload
- Endpoints: every source and destination with its state
- Devices: MAC addresses with the manufacturer from the IEEE OUI list
- Orphan flows: traffic nobody asked for
NETWORK MAP / DASHBOARD
See the paths
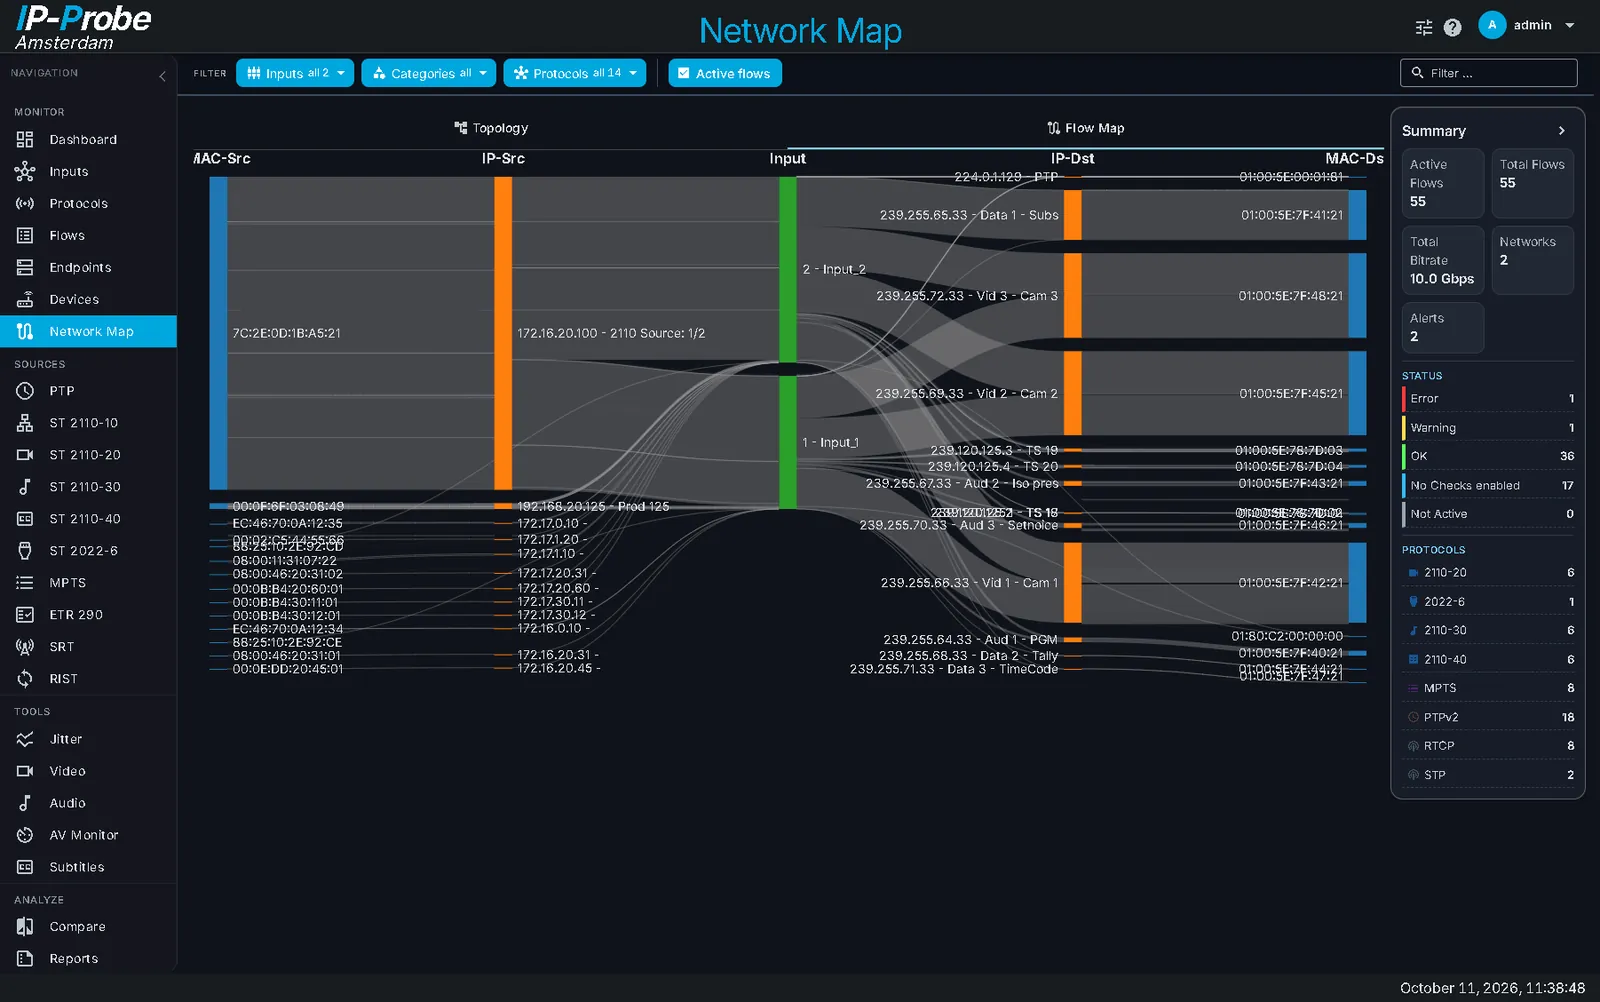
The topology view and the flow map show which sender reaches which receiver through which probe input.
- Flow map: source MAC, source IP, input, destination IP, destination MAC
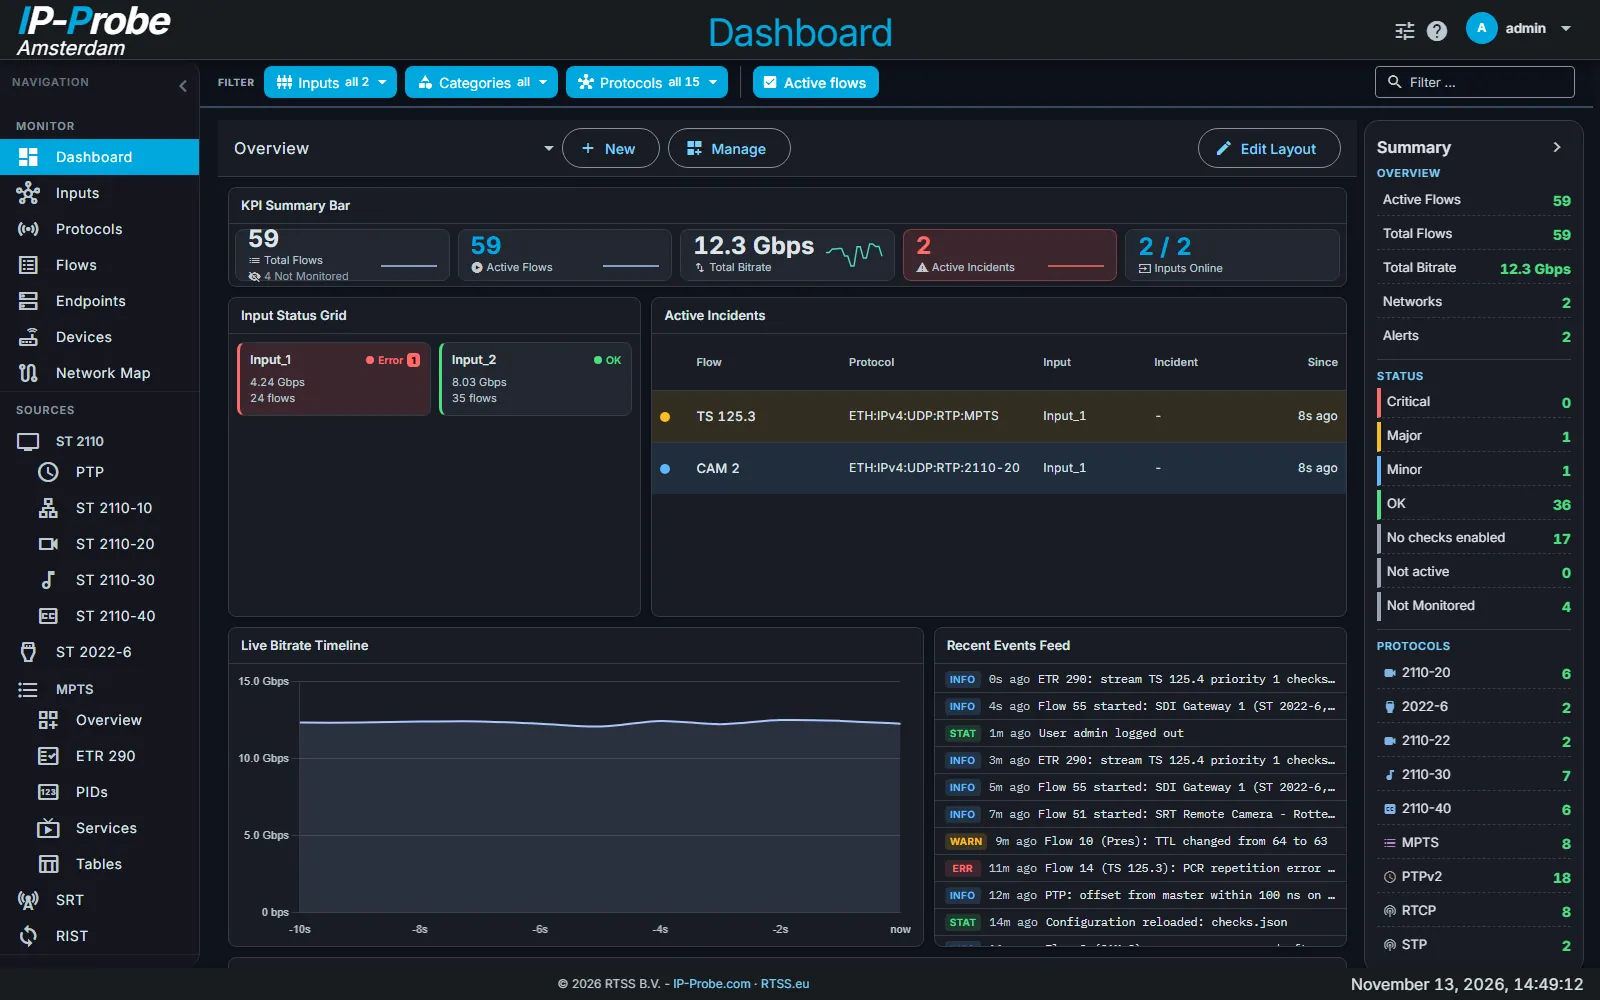
- Dashboards with widgets: KPI, bitrate, incidents, heatmap, top talkers, PTP, NIC health
- Protocols page: protocol breakdown and flow health grid
SRT / RIST
Contribution over the internet
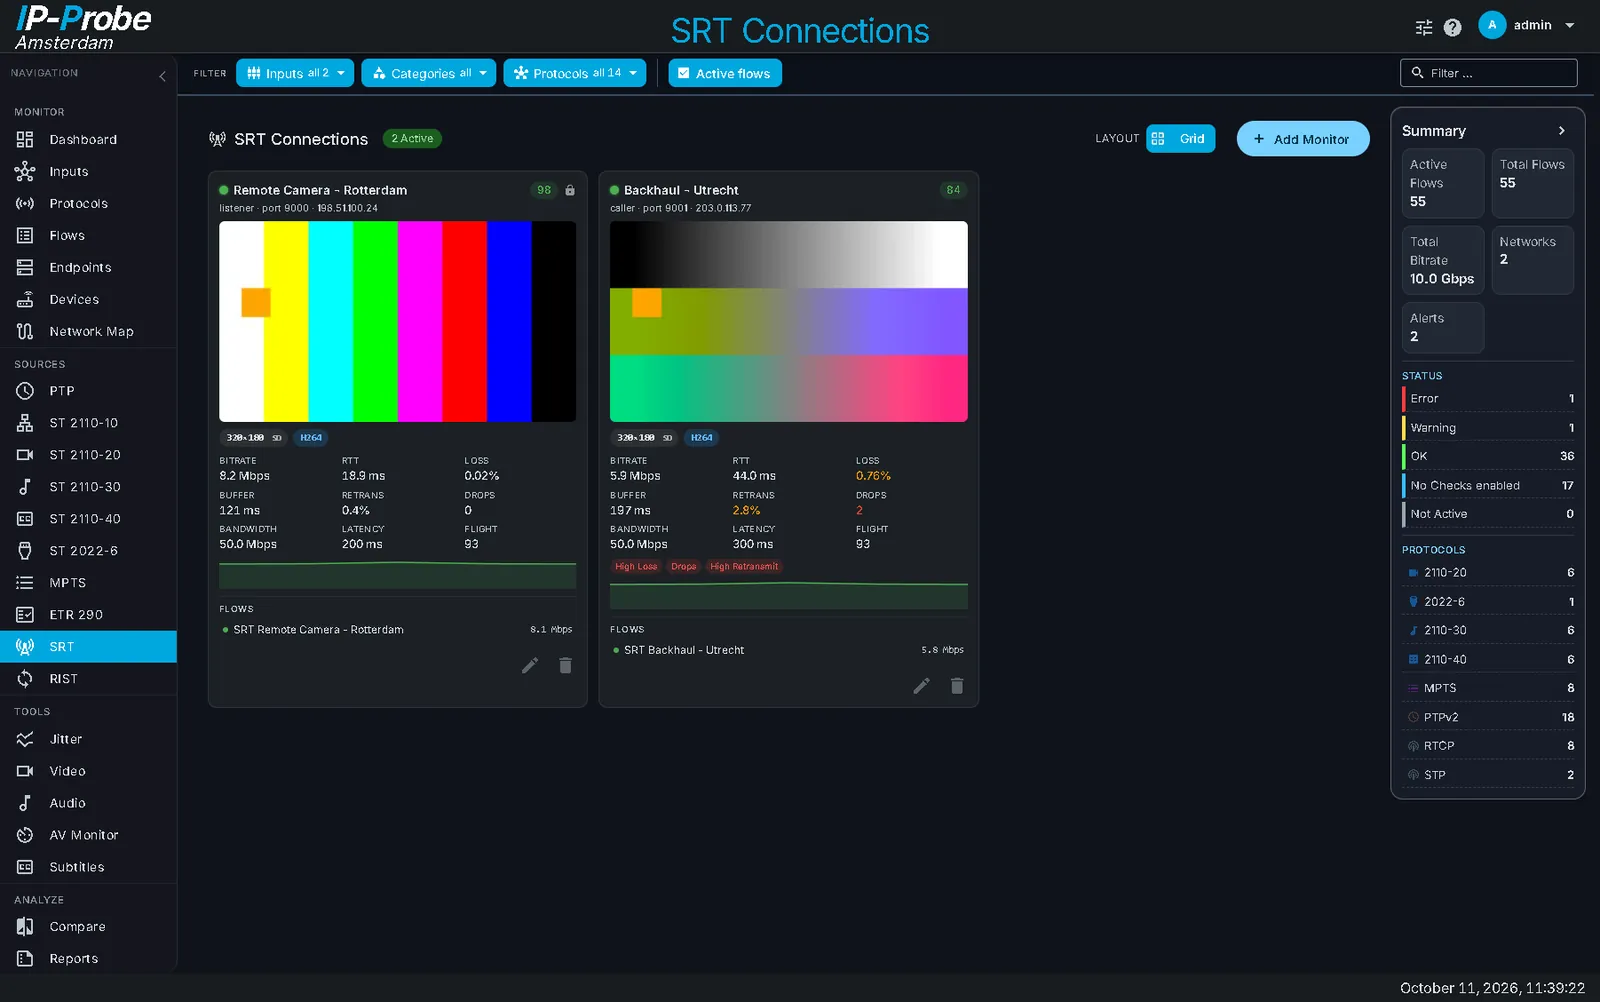
SRT and RIST connections are found automatically from their control and data packets. No endpoint configuration is needed.
- Connection overview with state per connection
- SRT and RIST statistics: loss, retransmissions, round trip
- Flow detail per connection
- Picture and audio of the stream with the Video and Audio options
INPUTS / SYSTEM HEALTH
A probe that watches itself
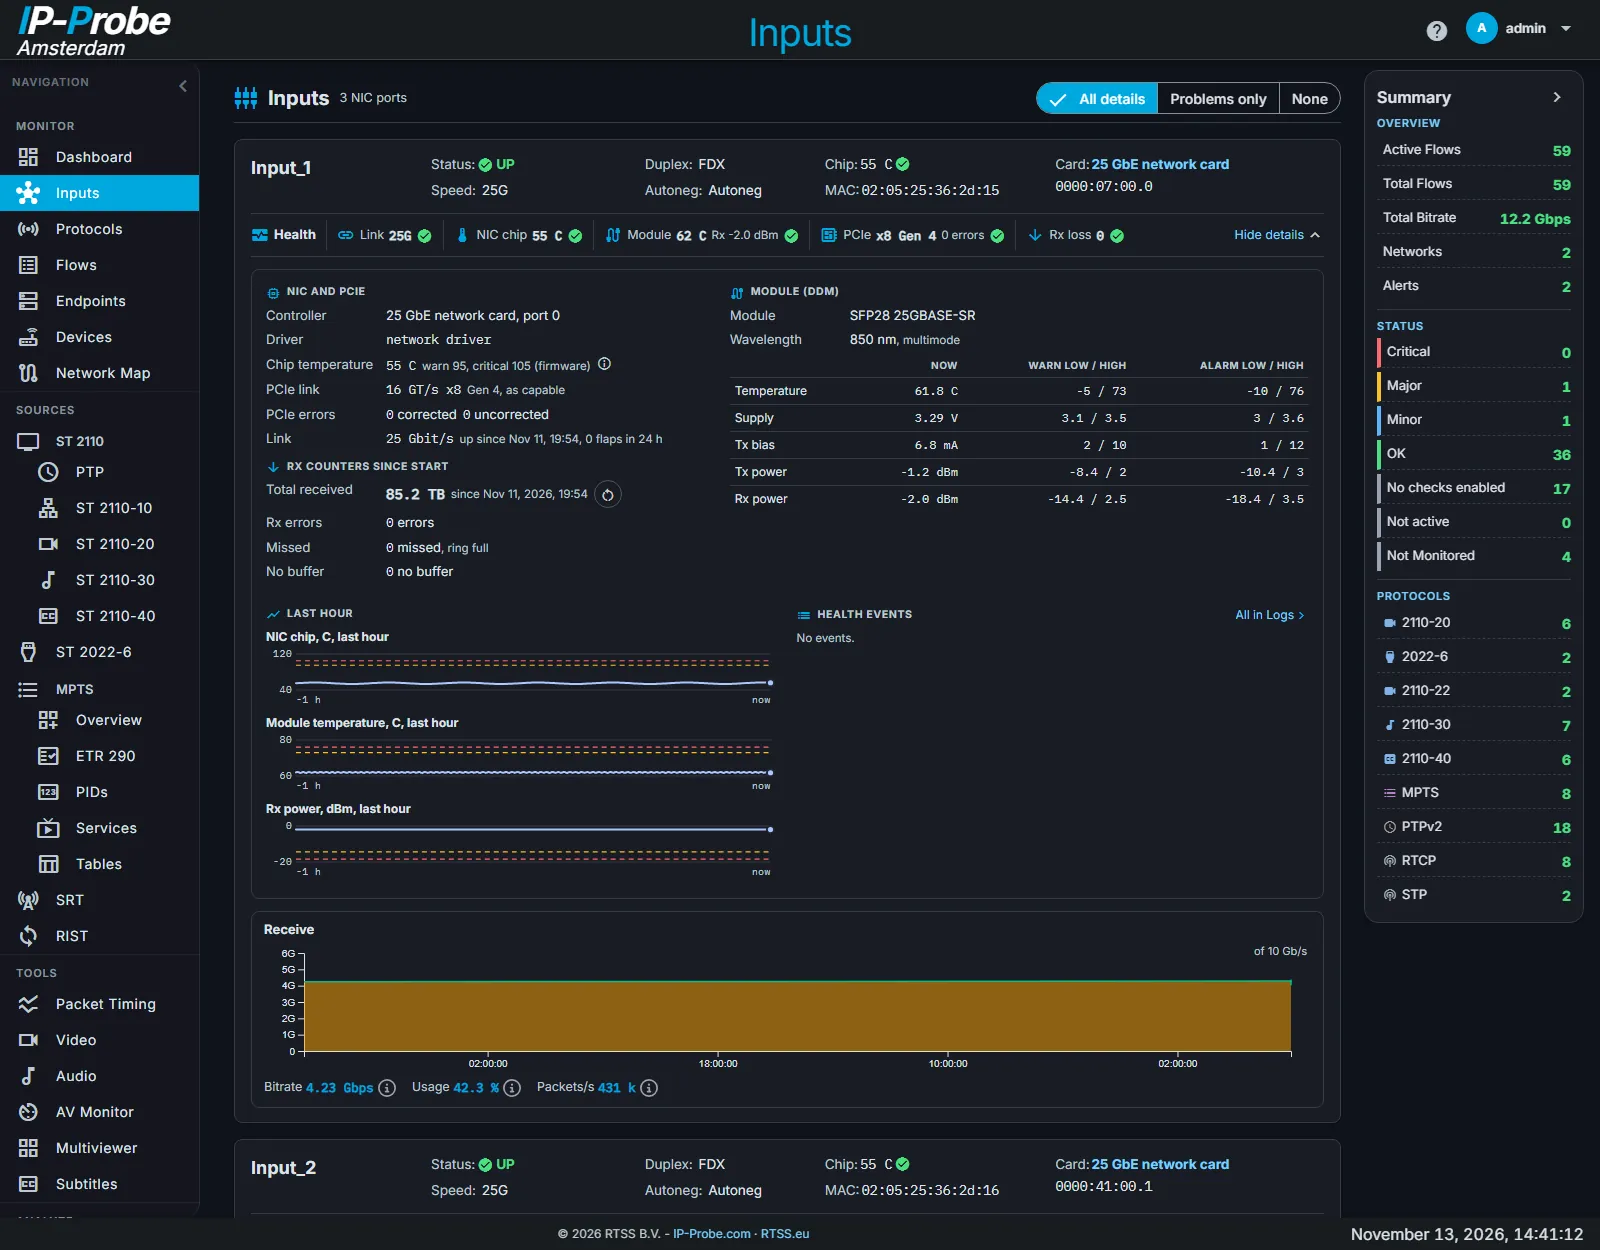
- Inputs: link, receive and transmit counters, missed packets per port
- Port chip and optical module temperatures, link state, Rx loss
- Capture stops on a port at the critical chip temperature, to protect the card
- Host temperatures and disk space, with a warning before the disk is full
- Run-in period after start or link-up, so a link coming up raises no false alarms
LICENSE: Base, Streaming
Which options this needs
Flows, endpoints, devices, network map, dashboards, packet timing and inputs are in Base. SRT and RIST need the Streaming option. How licensing works.